Market Profile Trading — User Guide
A complete reference for traders using this application.
1. Market Profile Concepts
Market Profile is a charting methodology that organises price data by time spent at each price level rather than by time intervals. Each 30-minute trading period is represented by a letter (A, B, C…). Every price level touched during that period receives the letter — producing the classic vertical letter display.
TPO (Time Price Opportunity)
Each 30-minute period is one letter. A price level that appears in many periods (many different letters) has high TPO count — the market spent a lot of time there.
POC — Point of Control
The price level with the highest TPO count for the day. This is the fairest price as determined by time. Displayed in blue.
Value Area (VAH / VAL)
The range containing 70% of the day's TPO activity, centred around the POC. VAH (Value Area High) in green, VAL (Value Area Low) in red. Price outside this range is considered "out of value".
Initial Balance (IB)
The high and low of the first two 30-minute periods (first 60 minutes). Displayed in orange. IB extensions above IBH or below IBL signal directional intent.
VPOC — Volume Point of Control
The price level with the highest traded volume (not TPO count). Often coincides with POC but can diverge — a divergence can signal institutional activity.
VWAP
Volume-Weighted Average Price for the session. Used as a benchmark: price above VWAP is generally bullish context; below is bearish.
HVN — High Volume Node
A price level with significantly above-average volume and a local peak in the volume profile. Acts as a magnet — price tends to return to and accept around HVNs.
LVN — Low Volume Node
A price level with very low volume, a local trough in the volume profile. Price tends to move quickly through LVNs — they act as support/resistance boundaries.
Day Types
Trend Day — strong directional move, narrow value area.
Normal Day — balanced session, value area near the middle.
Normal Variation — slight range extension on one side.
Neutral Day — extensions on both sides, closes near centre.
Non-Trend — very narrow range, low conviction.
2. Typical Workflow
- Upload Data — load 1-minute CSV data and generate daily profiles.
- Profiles — review historical sessions, TPO charts, and S/R levels.
- Rules — select and configure the trading rules to test.
- Backtest — run a backtest against the loaded data.
- Results / Statistics — analyse rule performance and alert frequency.
- Optional (FXCM): Connect, subscribe to live data, run alerts or auto trading.
3. Upload Data
Load historical intraday data to power the profiles, backtest, and chart pages.
- File format: CSV with columns
Date, Open, High, Low, Close, Volume. Multiple date formats are auto-detected. - Tick size: Auto-detected from price precision. A recommended tick size (based on average daily range / 200 rows) is suggested — you can override it.
- Session hours: Filter quotes to the regular trading session (e.g. 08:00–22:00). Only bars within this window are used for profile calculation.
- After upload, click Calculate Profiles to generate all daily market profiles.

4. Profiles
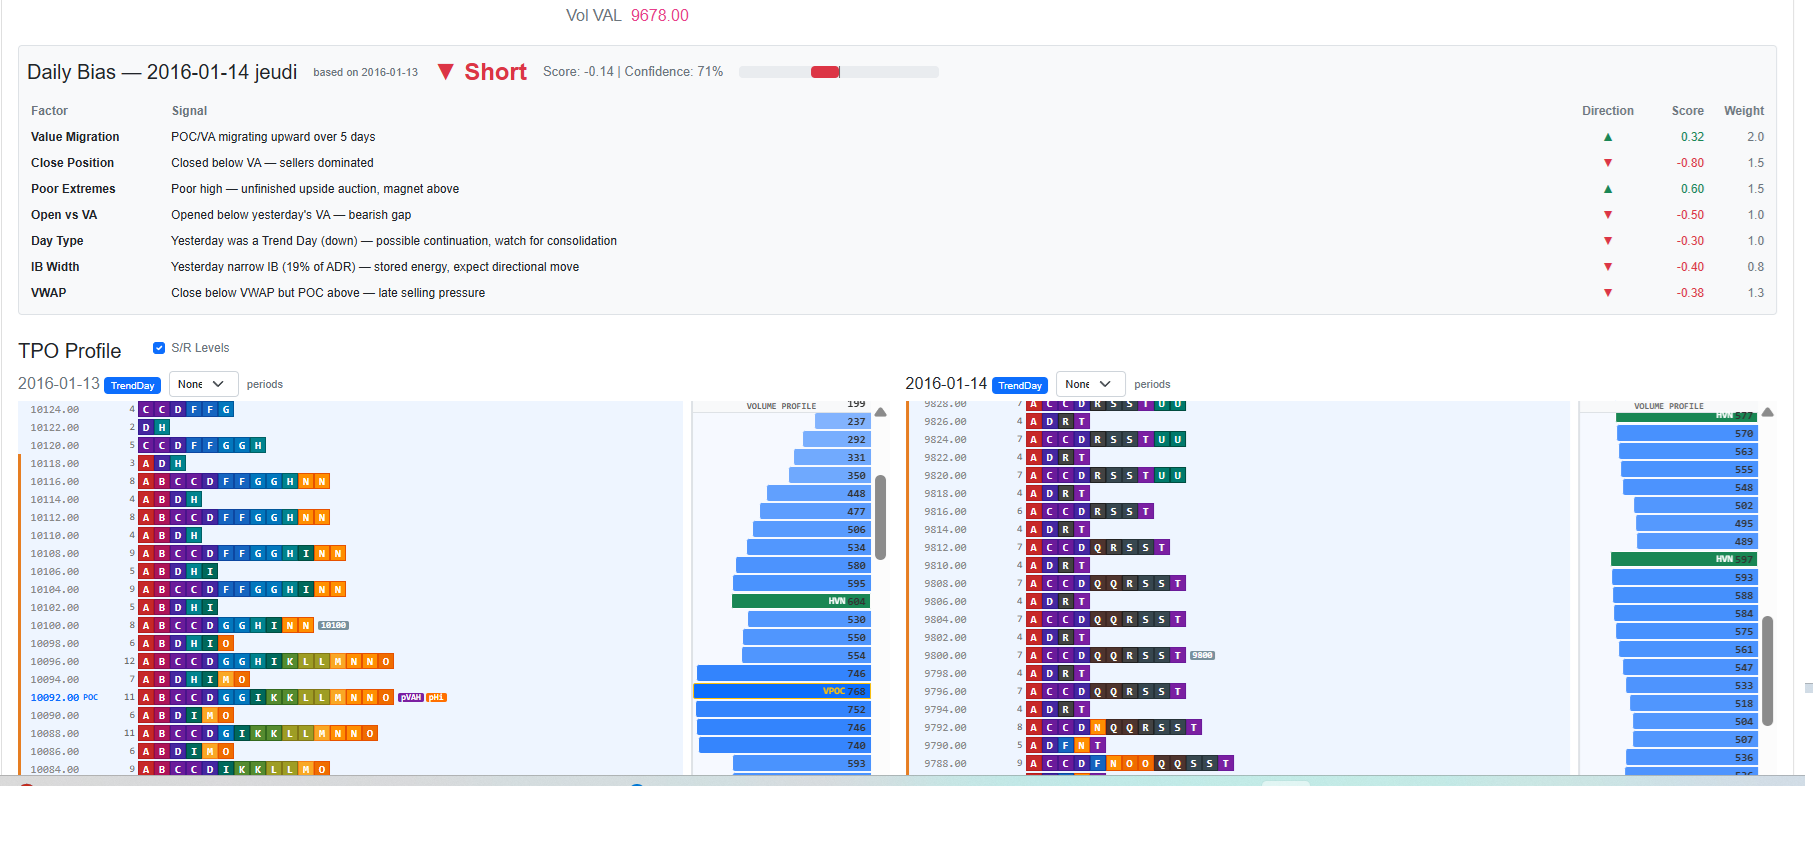
The main analysis view. Shows two TPO charts side by side: the previous day on the left, the selected day on the right.
- Navigate between sessions with Prev / Next or the date dropdown.
- The right chart shows S/R level labels for the selected day (current day's VWAP, round numbers, confluence zones).
- The left chart (previous day) shows all previous day levels as reference overlays on the right chart — labelled
pPOC,pVAH,pVAL,pVPOC,pIBH,pIBL,pOp,pHi,pLo,pCl,pVWAP,pVVAH,pVVAL. - Confluence zones (
x2,x3…) highlight prices where POC/VAH/VAL have aligned across the last 10 days. - Daily Bias panel shows a long/short score derived from previous sessions to frame the day's directional context.
- Period A summary shows the first 30-minute period's range, open, and volume.
- Each TPO chart includes a Volume Profile panel on the right side, colour-coded by volume intensity, with VPOC, VVAH, VVAL, HVN, and LVN markers.

5. Chart
An interactive candlestick chart of the loaded instrument.
- Supports multiple timeframes built from the 1-minute base data.
- Overlays previous day S/R levels (POC, VAH, VAL, IB, VWAP, VPOC) as horizontal lines.
- Can display live FXCM price data when connected.

6. Rules
Configure which Market Profile trading rules are active and their trade parameters.
- Each rule has a direction (Long / Short / Both), a description, and configurable Take Profit and Stop Loss in points.
- The R:R column shows the reward-to-risk ratio calculated automatically.
- Use Enable All / Disable All to quickly toggle the full rule set.
- Rules cover setups such as Open Drive, Open Test Drive, Open Rejection Reverse, POC Touch, IB Extension, Value Area plays, trend continuation, and more (~30 rules total).

7. Backtest
Runs enabled trading rules against the loaded historical profile data.
- Configure trading costs: spread (in points), commission per lot, and slippage.
- Click Run Backtest to start. A progress indicator is shown; you can cancel at any time.
- On completion, results are automatically displayed on the Results page.

8. Results
Detailed performance breakdown of the last backtest run.
- Summary: total trades, win rate, gross P/L, net P/L (after costs), profit factor, and average trade.
- Per-rule table: sortable by net P/L, win rate, or number of trades. Each row can be expanded to show every individual trade with entry/exit time, price, direction, and result.

9. Statistics
Analyses how frequently each alert rule triggers historically — useful for understanding which conditions are common vs. rare.
- Shows days triggered, average triggers per day, and breakdowns by session phase.
- Helps calibrate which rules are worth monitoring live.

10. FXCM Connection
Connect to your FXCM account to access live data and trading.
- Connect page: enter account credentials (Demo or Real), select instruments, configure session hours, and connect. Once connected, the app subscribes to live price streams for all selected instruments.
- Download historical data from FXCM directly to populate profiles without a CSV file.
- Save to CSV: downloaded data can be saved locally for later use.
- FXCM Trading: manual order entry (market or limit), position monitoring, and trade history.


11. Alerts
Real-time monitoring of Market Profile conditions on live FXCM price data.
- Alert rules fire when price interacts with key levels (POC touch, VA breach, IB extension, excess rejection, single print, etc.).
- Each alert shows instrument, rule name, trigger price, severity, and time.
- The Daily Bias panel displays a live long/short score for each subscribed instrument.
- A live mini-chart is embedded for quick visual context.
- Alerts can be enabled or disabled per rule.

12. Auto Trading
Fully automated trade execution based on the configured Market Profile rules.
- Select an instrument and add rules with custom TP/SL values and lot sizes.
- Click Start to activate the engine. The engine fetches recent historical data, builds profiles, and begins monitoring the live price stream.
- The trade log shows every signal, order fill, and account position update in real time.
- Click Stop to halt the engine. Open positions are not automatically closed on stop.

13. Leverage Reference
A reference table of FXCM leverage tiers, contract sizes, maximum leverage, and margin requirements by instrument category (FX majors, crosses, commodities, indices, bonds). Use this to calculate required margin before sizing positions.

14. S/R Level Label Reference
| Label | Description | Source |
|---|---|---|
| POC | Point of Control (highest TPO count) | Current day |
| VAH | Value Area High (TPO-based) | Current day |
| VAL | Value Area Low (TPO-based) | Current day |
| IBH / IBL | Initial Balance High / Low (first 60 min) | Current day |
| OPN | Session open price | Current day |
| VPOC | Volume Point of Control | Current day (volume profile panel) |
| VVAH / VVAL | Volume Value Area High / Low | Current day (volume profile panel) |
| HVN | High Volume Node | Current day (volume profile panel) |
| LVN | Low Volume Node | Current day (volume profile panel) |
| VWAP | Volume-Weighted Average Price | Current day |
| pPOC | Previous day Point of Control | Previous day |
| pVPOC | Previous day Volume POC | Previous day |
| pVAH / pVAL | Previous day Value Area High / Low | Previous day |
| pVVAH / pVVAL | Previous day Volume Value Area High / Low | Previous day |
| pIBH / pIBL | Previous day Initial Balance High / Low | Previous day |
| pOp | Previous day open | Previous day |
| pHi / pLo | Previous day high / low | Previous day |
| pCl | Previous day close | Previous day |
| pVWAP | Previous day VWAP | Previous day |
| Round numbers | Significant round price levels | Auto-calculated |
| x2, x3… | Confluence: POC/VAH/VAL aligned across N of last 10 days | Multi-day |